View Agent Logs
Agent logs show real-time information about what your agent is doing -- tool calls, LLM interactions, errors, and memory operations. Useful for debugging and understanding agent behavior.
Prerequisites
- A running agent
Steps
1. Open the logs viewer
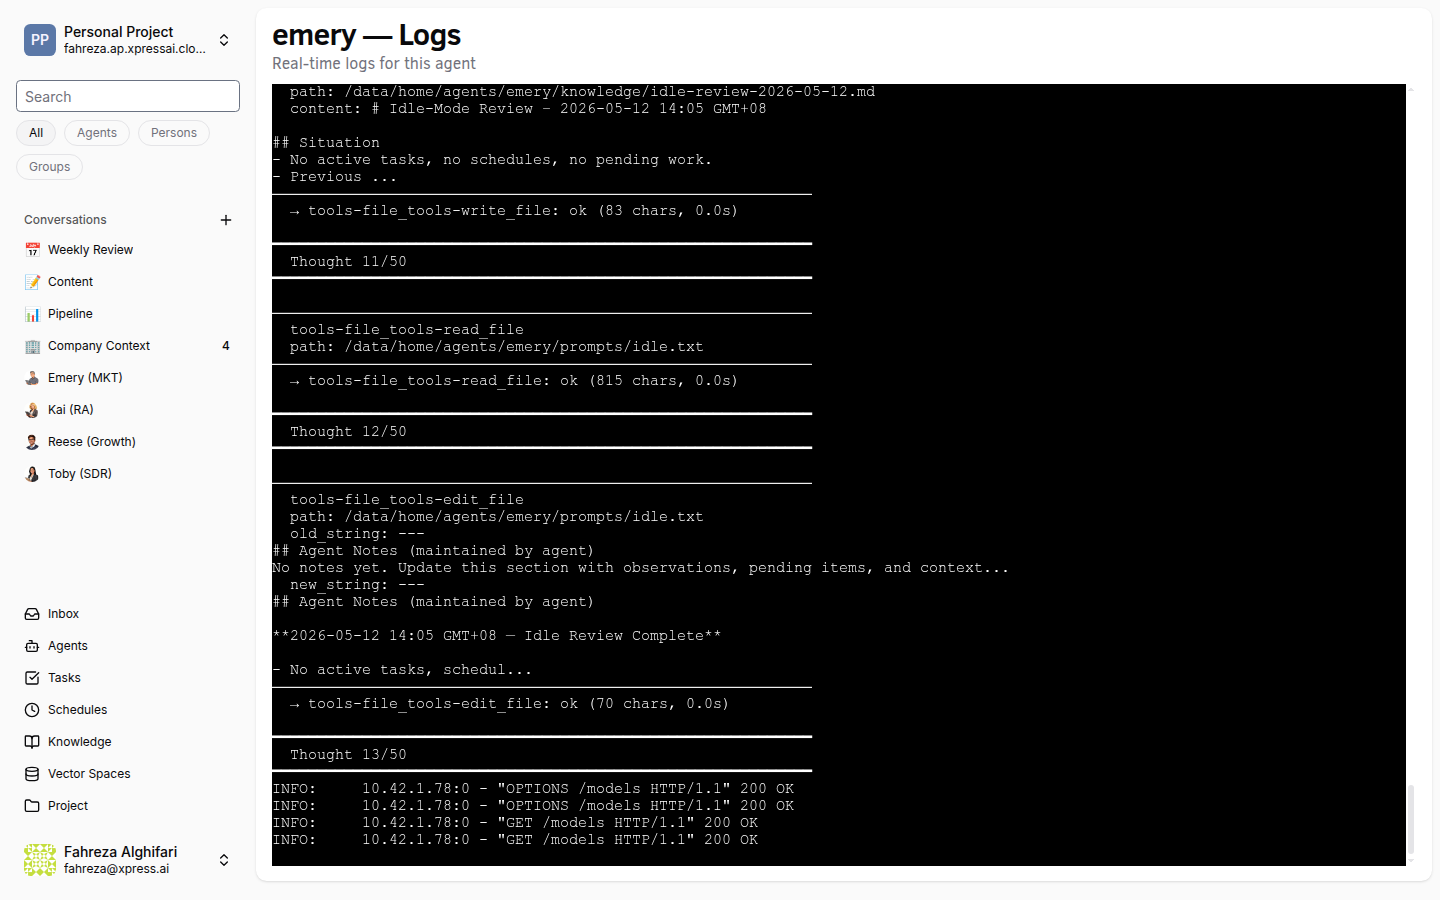
Navigate to Agents in the sidebar. Find your agent in the list and click the logs icon (a small terminal/console icon on the right side of the agent's row, next to the other action buttons). This opens a real-time log stream in an embedded terminal (XTerm) in your browser.
2. Read the log output
Logs stream in real time via a WebSocket connection. You will see entries for:
- Tool calls -- which tools the agent invokes, with input parameters and return values.
- LLM interactions -- prompts sent to the language model and responses received.
- Errors -- stack traces and error messages when something goes wrong.
- Memory operations -- reads and writes to the agent's knowledge base.
3. Search within the logs
Use your browser's built-in search (Ctrl+F or Cmd+F) to find specific entries in the terminal output.
4. Keep the viewer open
The log stream stays active as long as the tab is open. New entries appear at the bottom in real time. If you navigate away and come back, the stream reconnects automatically.
Verify
- Send a message to the agent in a conversation while the logs viewer is open. You should see corresponding log entries for the agent processing your message.
Logs are especially useful when an agent produces unexpected results. Look for error entries or unexpected tool call parameters to diagnose the issue.
The logs viewer uses a WebSocket subscription under the hood. If the connection drops (e.g., due to network issues), refresh the page to reconnect.